
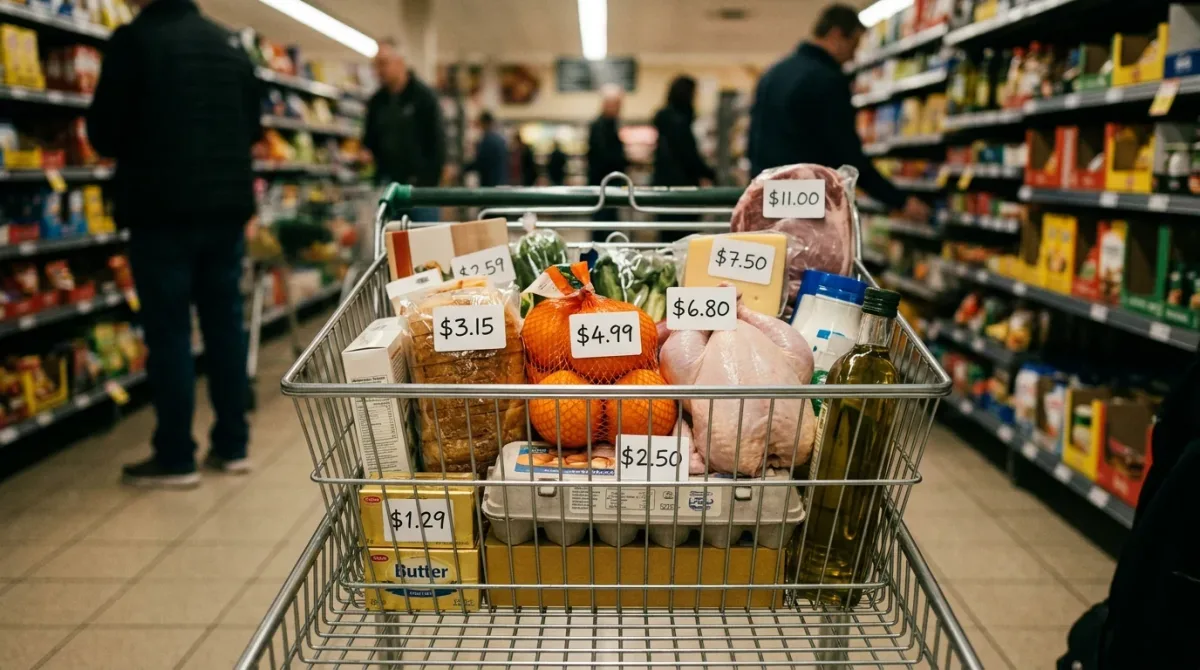
The Consumer Price Index is built each month from roughly 80,000 individual prices the Bureau of Labor Statistics collects at stores, service businesses and rental units nationwide, then combined using expenditure weights from the Consumer Expenditure Survey, according to the BLS. For July 2026, the resulting all-items index rose 0.1% from June on a seasonally adjusted basis and 3.4% over the prior 12 months, while core CPI — the index excluding food and energy — rose 0.2% for the month and 2.5% year over year, the BLS reported August 12, 2026.
What actually goes into the index?
The CPI tracks "all goods and services purchased for consumption by the reference population," organized into more than 200 item categories grouped under eight major headings: food and beverages, housing, apparel, transportation, medical care, recreation, education and communication, and other goods and services, according to the Bureau of Labor Statistics. The basket also includes government user fees, such as water charges, auto registration and tolls, and sales or excise taxes tied directly to a purchase. It excludes investment items like stocks and life insurance, and it excludes income taxes.
Each category's influence on the index — its weight — comes from actual household spending, not a fixed formula set once and left alone. That distinction determines why a given price move, like a jump in egg prices, can shift the headline number by more in one year than another.
Where do the spending weights come from?
Weights are drawn from the Consumer Expenditure Surveys, in which more than 20,000 consumer units report quarterly spending and roughly 12,000 keep two-week diaries of frequently bought items such as groceries and gasoline, the BLS says. That expenditure data sets the relative importance of each item category in the index structure.
The survey data lags real time by design. The BLS has noted that CPI weights used in a given year are typically drawn from expenditure surveys conducted roughly two years earlier, meaning the basket reflects how households spent money in the recent past rather than the current month. The weights are updated annually with the January CPI release.
How are the prices themselves collected?
BLS data collectors visit retail stores, service establishments, rental units and doctors' offices throughout each month, which is divided into three roughly 10-day collection periods. Food, energy and a rotating set of other items are priced monthly; most other commodities are priced every other month, split into even-month and odd-month samples, according to the BLS. Online prices made up about 16% of quotes in the CPI sample as of the agency's most recent published estimate.
When a specific product a collector normally prices is discontinued or changes — a cereal box shrinks, a phone model is replaced — BLS specialists apply one of three quality-adjustment methods: treating a near-identical replacement as directly comparable, estimating the dollar value of a specification change, or imputing a price change from similar items when a direct comparison isn't possible. The goal is to isolate a pure price change from a change in what's actually being sold.
What formula turns 80,000 prices into one number?
Calculation happens in two stages. First, BLS computes roughly 7,776 basic indexes, each covering one item category in one of 32 geographic areas. Most of these use a geometric mean formula — in place since January 1999 — which weights the ratio of a current price to its prior-period price and allows for a modest amount of consumer substitution as relative prices shift within a category. A modified version of the older Laspeyres formula, which compares a fixed-quantity basket's cost across two periods, still applies to shelter, utilities and some medical services, where substitution behavior is harder to model.
Second, those basic indexes are aggregated into the broader indexes — food, housing, the all-items headline figure — using the Consumer Expenditure Survey weights described above. The published all-items and core figures are the end product of that two-stage process, not a single average of retail prices.
Why strip out food and energy for the "core" figure?
Core inflation — the CPI measure excluding food and energy — exists because those two categories swing sharply from week to week for reasons unrelated to broader price trends, such as a drought or a refinery outage. The BLS publishes both the all-items index and the core index each month so that a single volatile category doesn't obscure or exaggerate the underlying trend. In July 2026, core CPI rose 0.2% month over month against a 0.1% all-items gain, with the BLS noting shelter costs contributed roughly two-thirds of the monthly all-items increase while energy prices fell 1.5%.
| Measure | Month-over-month (July 2026, seasonally adjusted) | Year-over-year (12 months to July 2026) |
|---|---|---|
| All-items CPI-U | +0.1% | +3.4% |
| Core CPI-U (ex food and energy) | +0.2% | +2.5% |
CPI-U or CPI-W: which index applies?
The headline figure most often quoted is CPI-U, covering all urban consumers — over 90% of the U.S. population, including core-based statistical areas and urban places of 10,000 or more people, per the BLS. It excludes rural non-metro residents, farm households, active-duty military and people in institutions. A narrower index, CPI-W, covers urban wage earners and clerical workers — about 30% of the population — and requires that a household draw more than half its income from wage employment in specific occupational categories. CPI-W is the index used to calculate the annual Social Security cost-of-living adjustment.
When is the next reading due?
The BLS publishes CPI-U, CPI-W and the chained C-CPI-U measure monthly. The August 2026 report is scheduled for release Friday, September 11, 2026, at 8:30 a.m. Eastern, according to the agency's release calendar.
For a related economy news perspective, read BLS Prices Nearly 80,000 Items to Build the CPI.
For more context, read Complete Guide to Building a Sustainable Wellness Routine.
For more context, read What a “was” price actually claims — and how to check it.
For more context, read What Dollar-Cost Averaging Means and How It Works.